Most founders asking about break even analysis are really asking the wrong question.
The question isn't whether a new marketplace launch can generate sales. It's whether the ecosystem you're entering can carry your brand to profitable scale without stripping out margin through fulfilment friction, compliance costs, customer acquisition pressure, and poor localisation decisions. A product can look successful in a marketplace dashboard and still be commercially weak.
One pattern we continue seeing is established hardware, household, and home improvement brands treating international expansion as a channel extension when it is an ecosystem transition. The listing goes live, orders arrive, internal teams relax, and only later does the underlying problem show up. Revenue grew, but the commercial model didn't hold.
That's where break even analysis stops being a finance team exercise and becomes a leadership discipline. Used properly, it tells you whether your pricing, fulfilment structure, catalogue mix, and market-entry assumptions are aligned with reality. Used poorly, it gives founders false confidence at exactly the moment they need sharper judgement.
The Real Cost of International Marketplace Expansion
If you're entering the US, Canada, or UK marketplace environment with domestic assumptions, you're probably underestimating your real cost base.
That's not because the formula is complicated. It's because marketplace ecosystems introduce costs that don't sit neatly inside the early planning model. Customer acquisition behaves differently. Returns move differently. Fulfilment service levels affect conversion. Compliance creates drag. Local buyer expectations force changes in packaging, pricing logic, and content structure.
Revenue hides a lot of bad decisions
Across multiple marketplace ecosystems, the same commercial mistake appears early. Teams focus on topline launch velocity and treat profitability as something to clean up later. That works for almost nobody in established product categories.
A recent marketplace review revealed a familiar pattern in premium household and home organisation brands. The product was proven. The catalogue looked strong. The operational team assumed the brand could carry its domestic economics into a new region with only minor adjustments. It couldn't. The ecosystem required different fulfilment logic, different promotional pacing, and tighter control over who handled the brand in-market.
Strong sales can disguise weak expansion economics for longer than most founders expect.
That's why channel design matters before launch, not after it. Distribution shape affects the cost to serve, the consistency of customer experience, and the confidence a marketplace algorithm has in your offer. For brands thinking about structure before scale, Amazon distribution strategy is usually a more important conversation than listing volume.
The cost base shifts by ecosystem, not just geography
What becomes visible during international expansion is that costs don't merely increase. They reorganise.
In a mature marketplace, buyers expect fast delivery, localised trust signals, and low-friction returns. If your offer doesn't meet those expectations, conversion weakens and your effective acquisition cost rises. If your operational setup can't support replenishment discipline, stock gaps disrupt ranking and force more paid recovery activity. If your market entry relies on blunt discounting, the brand may generate demand but train the wrong customer behaviour.
Three issues repeatedly sit underneath failed margin assumptions:
- Fulfilment structure: The choice between local stockholding, distributor support, or marketplace-managed fulfilment changes both cost and conversion.
- Localisation friction: Product copy, compliance language, packaging cues, and sizing logic affect whether a listing feels native or imported.
- Category maturity: Established categories punish weak economics faster because competitors already understand price architecture and service expectations.
The commercial implication is simple. A marketplace launch isn't successful because it sells. It's successful when the ecosystem supports profitable repetition.
Recalibrating Break Even Analysis for Marketplace Ecosystems
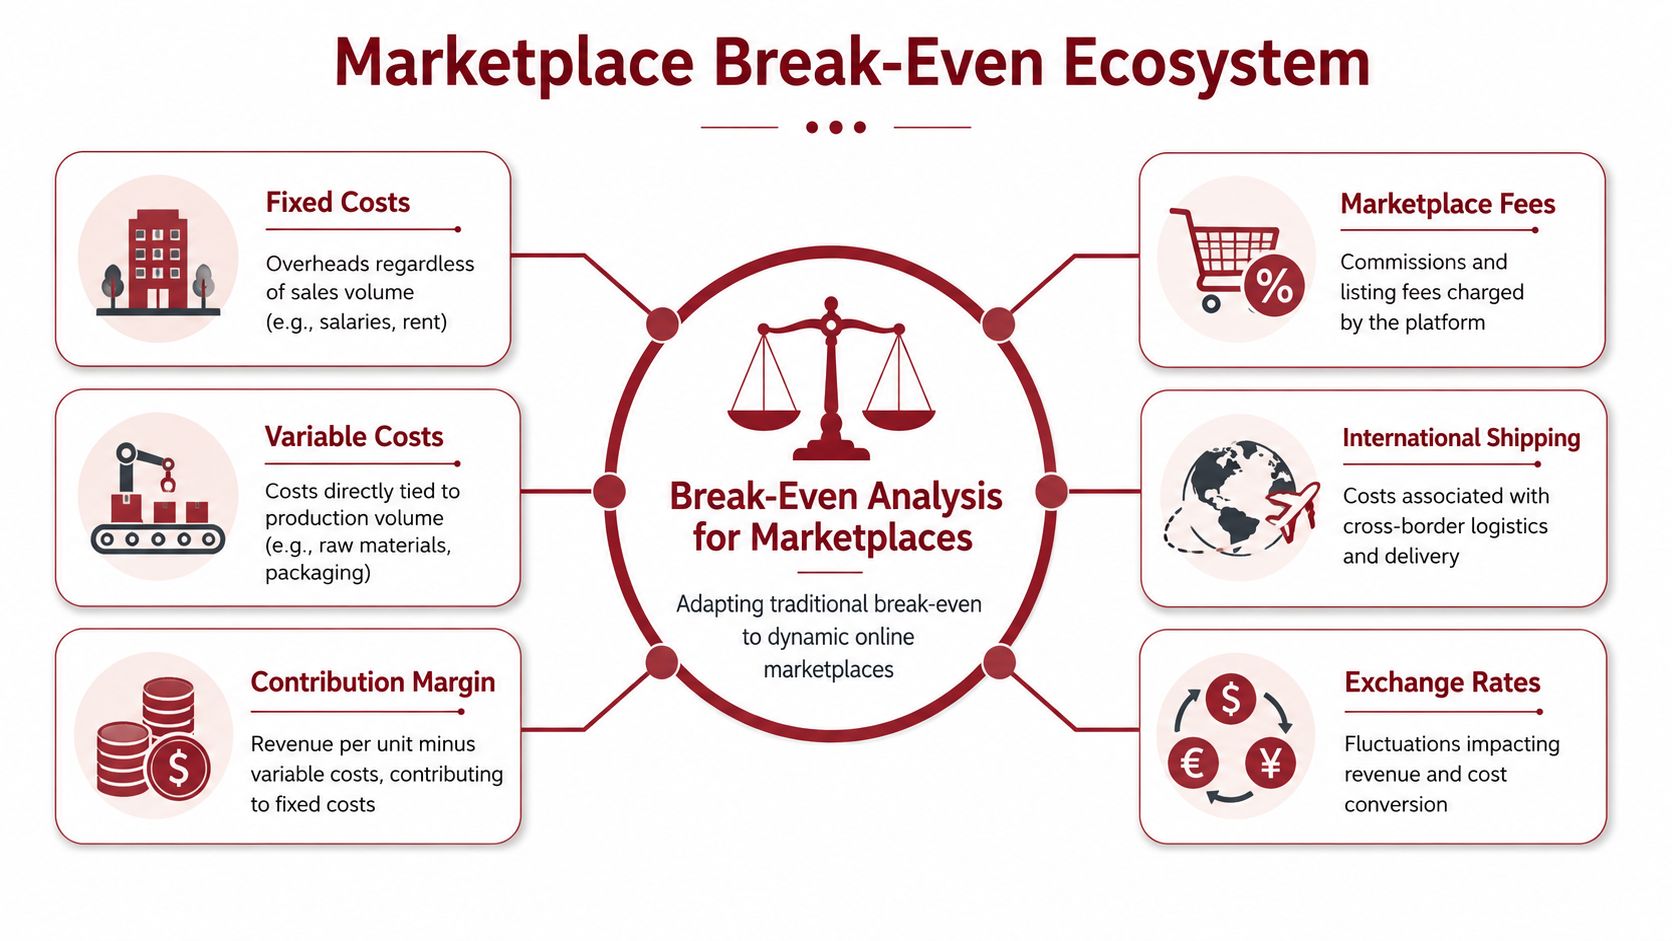
Traditional break even analysis starts with a sound formula. Break-even point in units = Total Fixed Costs ÷ (Selling Price per Unit – Variable Cost per Unit). That still matters. What changes in marketplaces is your definition of variable cost.
Variable cost is where most models fail
For Australian hardware and home improvement brands scaling into new channels, a break-even analysis must be anchored in the specific contribution margin of each product line. The Queensland Government notes that the BEP formula should explicitly include AU-specific logistics and compliance expenses, and that those costs can inflate variable costs by 12–15% compared to US/UK benchmarks, which directly lifts the break-even volume required to reach profit equilibrium, as outlined in the Queensland guidance on break-even and profit.
That matters because many founders still model variable cost too narrowly. They include landed product cost and packaging, then stop.
In practice, marketplace operators need a broader variable cost lens:
- Marketplace commissions: These sit inside each sale and reduce contribution margin immediately.
- Fulfilment fees: FBA and 3PL structures don't just alter service speed. They change unit economics.
- Region-specific compliance: In hardware and regulated consumer categories, certification and packaging adaptation often travel with the product line.
- Paid acquisition tied to sell-through: A large portion of marketplace media spend behaves like a variable selling cost, not a pure overhead.
- Returns processing: Return rates vary by category and region, but the important point is operational. Returns aren't just a service issue. They alter contribution margin.
Product-level modelling beats blended assumptions
One issue we repeatedly observe is brands using a business-wide gross margin assumption when the catalogue contains very different contribution profiles. That creates false comfort.
A premium storage product, a consumable refill, and a larger assembled household item may all sit in the same catalogue, but they don't carry the same fulfilment burden, return risk, or advertising dependence. If you use one blended margin number, the model loses decision value.
Practical rule: If a product line has a different fulfilment profile, return pattern, or compliance burden, it deserves its own contribution margin model.
That's also why margin deterioration often appears gradual rather than dramatic. No single line item looks catastrophic. The issue is cumulative. Small marketplace frictions stack into a lower contribution margin, and a lower contribution margin pushes the break-even point further out.
For brands dealing with unexplained profitability pressure, why margins are shrinking on Amazon is usually less about one fee increase and more about a cost structure that was never fully recalibrated for the ecosystem.
A better operator question
Don't ask, “What's our break-even point?”
Ask, “What has to be true about contribution margin in this marketplace for the model to work?”
That question forces operational honesty. It brings pricing, fulfilment, and channel design into the same commercial conversation.
A Practical Calculation for a Single Product Launch
Single-product planning is where break even analysis becomes useful very quickly. It strips away catalogue complexity and forces the team to validate the commercial foundations of one launch before scaling assumptions spread across the business.

Start with clean inputs, not optimistic ones
A reliable single-product model needs five decisions made properly:
Selling price
Use the price you can hold in-market, not the price you hope to hold after launch excitement settles.
True variable cost per unit
This should include product cost, packaging, inbound freight, marketplace selling fees, fulfilment cost, and sales-linked advertising where relevant.
Fixed launch cost
Separate reusable launch costs from ongoing sales-linked costs. Founders often mix these together and distort the model.
Expected contribution margin
This is the amount each unit contributes toward covering fixed cost after variable costs are removed.
Time horizon
A launch judged over one quarter may look weak. The same launch judged over a longer operating window may look rational. The point is to choose deliberately.
A useful benchmark comes from Australian small business guidance. For an average Australian small business with fixed costs of $150,000 annually, a variable cost of $40 per unit, and a selling price of $90 per unit, the break-even point is exactly 3,000 units or $270,000 in annual revenue, according to MYOB's break-even analysis guide.
That example is simple, but the strategic lesson matters. The arithmetic isn't the hard part. The hard part is deciding what belongs in the cost stack.
Where operators usually get the numbers wrong
In a marketplace launch, the cleanest spreadsheet still fails if the inputs are soft.
Common errors include:
- Treating all marketing as fixed cost: In reality, a meaningful share of marketplace ad spend rises with sales activity.
- Using supplier cost instead of landed cost: Imported categories rarely fail because the ex-factory number was wrong. They fail because the all-in unit cost wasn't built properly.
- Ignoring return handling: This is especially dangerous in premium household products where presentation and packaging affect resale condition.
- Assuming domestic conversion logic transfers cleanly: It often doesn't.
Brands preparing for a structured entry usually benefit from thinking about the launch model in the same frame as a broader global product launch strategy. The product doesn't enter an empty market. It enters a cost environment, an expectation environment, and a competitive environment.
A short explainer can help teams align on the mechanics before they argue over assumptions.
A practical operator view
If you're launching a premium household product into Canada, the useful exercise isn't building one perfect model. It's building a model that can survive contact with reality.
The best break even analysis isn't the one with the neatest spreadsheet. It's the one that forces the team to challenge weak assumptions before the market does.
That means collecting real fee schedules, validating fulfilment pathways, pressure-testing price positioning, and identifying which costs move with each order. Once that discipline is in place, the formula becomes a decision tool rather than a finance ritual.
Modelling for a Multi-Product Catalogue
Single-SKU maths is tidy. Established brands rarely have that luxury.
Once a catalogue enters a marketplace, product mix starts shaping profitability as much as unit margin. A hero product may drive discovery but contribute less cash than accessories, attachments, refill lines, or complementary items. If the sales mix tilts too far toward low-contribution products, the business can look healthy on revenue and still sit too close to break-even.
Why weighted contribution margin matters
Australian businesses are already moving in this direction. The 2020–2025 period saw a 22% increase in Australian businesses using weighted-average contribution margin for multi-product break-even analysis, reflecting more complex distribution environments. The same source notes that a typical retailer with $200,000 in fixed costs and a 35% contribution margin must generate $571,428 in sales to break even, according to Square's guidance on calculating break-even point analysis.
That matters because multi-product expansion rarely fails due to one disastrous item. It usually weakens through mix drift.
A simple portfolio view
The weighted-average contribution margin method forces a more realistic planning discipline. Instead of asking whether each SKU is profitable in isolation, you ask whether the forecasted sales mix creates enough combined contribution to cover the operating base.
Here's a simple example structure.
| Product | Selling Price | Variable Cost | Contribution Margin | Sales Mix % | Weighted CM |
|---|---|---|---|---|---|
| Core product | $90 | $60 | $30 | 50% | $15 |
| Accessory item | $45 | $20 | $25 | 30% | $7.50 |
| Premium bundle | $140 | $85 | $55 | 20% | $11 |
| Total | 100% | $33.50 |
The table is illustrative rather than predictive, but the logic is what matters. Each product contributes differently. The weighted contribution margin depends on expected mix, not catalogue size.
What stronger operators watch
One pattern we continue seeing is teams overestimating the strategic value of a high-volume hero SKU while underestimating the role of adjacent lines in carrying the economics of the account.
A more mature catalogue review usually focuses on questions like these:
Which SKU wins visibility but compresses margin
Some products are useful as traffic drivers but dangerous if they dominate sales mix.
Which products absorb fulfilment complexity well
Smaller, simpler, lower-return items often provide more stable contribution than founders expect.
Which bundles improve commercial quality
Bundling can improve realised contribution if it aligns with buyer behaviour and doesn't introduce service friction.
Which lines distort replenishment
A catalogue with inconsistent demand patterns can raise working complexity and hurt profitable continuity.
That's why strong catalogues do not automatically create strong marketplace presence. Mix quality matters more than SKU count.
A wide catalogue can hide a weak economic engine just as easily as a narrow one can hide concentration risk.
The issue becomes even sharper during international scaling because local buyer behaviour changes the mix. The product that drives traction in Australia may not be the product that leads in the UK or Canada. The result is that your break-even model needs a regional sales-mix view, not just a global one.
For founders thinking about category concentration and outlier dependence, the logic behind power law distribution in marketplaces often explains why a few products end up shaping the economics of the whole account.
The table is only the beginning
Weighted-average contribution margin is useful, but it's still a model. Teams need to update it as the market reveals actual behaviour.
Three triggers usually justify a reset:
- The hero product starts dominating sales beyond the original forecast mix
- A lower-priced line pulls volume but weakens total contribution
- A premium bundle underperforms, removing a meaningful profit buffer
Operator discipline matters. If the sales mix changes, the break-even point changes. Founders who keep using the original model after the catalogue behaviour shifts usually end up making expansion decisions on stale economics.
From Calculation to Commercial Strategy
A break even analysis gives you a threshold. Commercial strategy decides what to do with it.
That distinction matters because marketplaces are dynamic. Fees move. Conversion changes. Buyer trust develops unevenly. Exchange rate movements affect pricing confidence and replenishment decisions. A model that works on paper can weaken quickly if leadership treats the break-even number as fixed.
Accounting break-even isn't enough
A frequently overlooked gap is the failure to address economic break-even, which includes the cost of equity capital. According to Yale School of Management, managers must earn a profit that covers the cost of equity annually to break even. The same source states that 38% of new Australian retail expansion projects fail within 18 months due to underestimated capital costs, as discussed in Scale Suite's break-even point calculator resource.

This is one of the biggest differences between operator-led expansion and opportunistic marketplace selling. Covering operating expenses may satisfy the accounting view. It doesn't necessarily justify the capital, management time, inventory risk, and strategic distraction involved in international entry.
Scenario thinking protects margin
One pattern we see in stronger businesses is that they don't stop at one break-even figure. They model pressure.
A practical strategic review asks:
What happens if fulfilment costs rise
The purpose isn't prediction. It's preparedness.
What happens if paid acquisition becomes less efficient
If media cost rises, contribution margin narrows quickly in ad-dependent categories.
What happens if the exchange rate turns against the model
International growth looks very different when currency movement compresses pricing flexibility.
What happens if returns become more expensive operationally
That can change the viability of specific SKUs, especially bulky or premium presentation-led products.
Commercial reality: The break-even number that matters most is the one that still works after your assumptions get less favourable.
Finance and marketplace strategy meet. Pricing architecture, fulfilment structure, market sequencing, and catalogue emphasis all become levers for defending the model. A weaker operator treats break-even as a report. A stronger one uses it to design resilience.
Better decisions sit upstream of the spreadsheet
Founders usually don't need more formulas. They need cleaner strategic interpretation.
If a market requires discounting to reach break-even volume, the issue may not be ad efficiency. It may be poor positioning. If a product can only work under one fragile fulfilment setup, the issue may not be launch execution. It may be a structurally weak ecosystem fit.
That's why financially rigorous brands often look slower from the outside. They enter fewer markets, carry fewer assumptions, and make fewer reactive decisions. But their expansion base is stronger because the economics were tested before the brand was stretched.
Building a Commercially Cohesive Expansion Plan
Break even analysis matters because it exposes whether a marketplace plan is commercially coherent.
Used properly, it tells you far more than the number of units required to cover costs. It shows whether your price architecture is realistic, whether your fulfilment structure supports conversion, whether your catalogue mix can carry overhead, and whether the capital committed to expansion has a rational path to return. That's a very different role from the basic accounting exercise most guides describe.
What becomes visible during international expansion is that marketplace performance isn't determined by listings alone. It's shaped by ecosystem cohesion. Localisation quality, operational structure, stock flow, compliance readiness, and margin discipline all sit inside the same system. If one part is weak, the break-even point moves against you.
That's why marketplace expansion is not a listing exercise. It's an ecosystem transition. Strong brands understand their break-even position in each region before they scale aggressively. They know which products deserve support, which costs need close monitoring, and which market conditions would make the model too fragile to pursue.
The brands that build durable international presence rarely rely on enthusiasm alone. They rely on commercial clarity.
TPR Brands works with established product companies that need that level of clarity before entering new regions, channels, and marketplace ecosystems. If you're evaluating international expansion and want an operator-led view of margin structure, localisation risk, fulfilment fit, and scalable channel design, start a conversation with TPR Brands.