Why do two brands enter the same category with solid products, competent teams and reasonable budgets, yet one compounds into a category leader while the other stalls in a respectable but narrow range?
Conventional planning usually answers that question with execution language. Better listings. Better media. Better retailers. Better forecasting. Those things matter, but they don't explain the deeper pattern. In marketplaces, outcomes rarely spread evenly. A small number of products, channels, search surfaces and customer pathways often capture a disproportionate share of value.
That pattern has a name: power law distribution. For founders and commercial directors, it matters because it changes how you read performance. It also changes how you expand internationally. If a market follows a power law shape, “average” performance stops being a useful organising principle. The tail and the top of the curve start telling you more than the middle.
The Invisible Structure of Marketplace Success
A brand can look diversified on paper and still be structurally exposed. It may have a broad catalogue, multiple channel partners and presence across several regions, yet a handful of commercial nodes can still determine most of the result.
That's the first useful way to think about a power law distribution. It isn't just a mathematical curiosity. It's an invisible organising structure inside complex commercial systems. In these systems, value doesn't distribute cleanly. It concentrates.
Why skew matters more than averages
One of the clearest Australian examples sits outside marketplaces but illustrates the point well. The Australian Bureau of Statistics reported that the top 20% of households held 62% of total household net worth in 2020–21, while the bottom 40% held just 2%, a pattern often modelled with a Pareto-style heavy tail that reflects the intuition behind a power law distribution, as noted in this overview of power law behaviour.
That matters because it gives founders a practical mental model. In a skewed system, the headline average hides what's really happening. A few observations dominate the total.
Practical rule: When value is highly concentrated, the commercial question isn't “What does the average account, SKU or channel do?” It's “Which small set of nodes controls the outcome?”
Across marketplace environments, that logic shows up repeatedly. A few hero SKUs create momentum for the catalogue. A few search terms capture the strongest buying intent. A few channel relationships influence most operational confidence. A few regions become the proving ground for the next stage of expansion.
Why this changes strategic reading
One issue we repeatedly observe is that brands interpret uneven performance as a temporary execution problem when it's often a structural market feature. They try to smooth the result instead of understanding the shape.
That's where many catalogue decisions go wrong. Teams assume a larger range automatically creates more opportunity. In reality, a larger range often creates more noise unless the surrounding ecosystem is cohesive. The difference between product breadth and commercial structure becomes especially clear when comparing a product catalogue and a marketplace ecosystem.
A power law distribution gives language to something operators already sense. Not all products are equally strategic. Not all channels deserve equal investment. Not all expansion markets should be treated as parallel opportunities.
Once you see that, growth planning becomes less about coverage and more about concentration, advantage, and control.
Understanding the Power Law Distribution
Most business planning still carries a hidden assumption. It assumes performance will cluster around a sensible middle. That assumption works reasonably well for some operational questions, but it breaks down in many marketplace settings.
A power law distribution behaves differently. Instead of most outcomes sitting near the centre, a small number of outcomes dominate the total. In brand terms, a few products may drive most demand, while a large number of other products contribute far less individually.
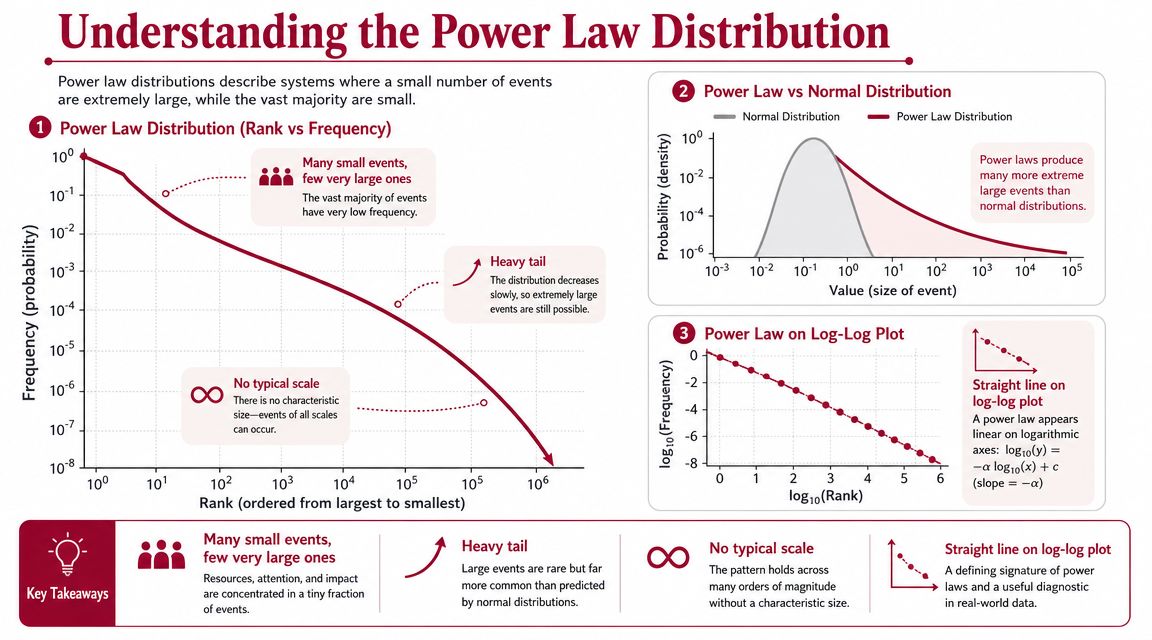
Bell curve thinking versus marketplace reality
The easiest contrast is with the familiar bell curve. Bell curve thinking leads teams to expect:
- Moderate variation: most SKUs should perform somewhere near the middle
- Reliable averages: average sales or average conversion can guide planning
- Predictable dispersion: weak and strong performers should remain within a manageable band
Marketplace reality is often less tidy.
In a power law environment, the gap between the top and the rest can be commercially decisive. The strongest SKU may not be a bit better than the median. It may be in a completely different economic category because it accumulates reviews faster, ranks more visibly, gets repeated retailer attention and receives more customer trust.
The fat head and the long tail
Operators often see this in catalogue reviews. A connected device range, a home organisation line or a household essentials brand may contain a fat head and a long tail.
The fat head is the visible commercial engine. These are the products that earn the strongest repeatability, dominate discoverability and justify tighter inventory discipline. The long tail is broader and quieter. It includes slower sellers, niche variants, market-specific configurations and test products that may still play an important role.
A useful way to think about the two is below.
| Part of the distribution | Commercial role | Common mistake |
|---|---|---|
| Fat head | Drives visibility, confidence and disproportionate revenue contribution | Underinvesting because the product already appears to be “working” |
| Long tail | Supports assortment depth, niche demand and experimentation | Expecting all tail products to behave like scaled winners |
The long tail isn't useless. It just serves a different job than the head.
Why the average can mislead
Consequently, experienced operators start making different decisions from purely analytical teams. If your catalogue follows a power law shape, the average SKU can become a dangerous fiction. It describes the portfolio statistically, but not operationally.
That affects:
- Inventory planning, because stock depth should follow commercial importance, not equal treatment.
- Content investment, because discoverability around top products compounds.
- International rollout, because a market entry rarely succeeds by launching everything at once.
- Channel management, because tail products may belong in different retail or marketplace contexts than head products.
A recent marketplace review revealed this tension clearly in premium consumer categories. Teams often spread resources across too many middling opportunities, then wonder why the catalogue never develops real market gravity. In a power law distribution, gravity usually forms around a small number of commercial anchors first. The rest of the ecosystem only makes sense once those anchors are protected.
How to See Power Laws in Your Own Data
You don't need a research team to spot a power law distribution in commercial data. You need a way to stop looking at blended summaries and start looking at rank and concentration.
The practical test is simple. List products, channels or customer accounts from strongest to weakest. Then examine how quickly performance falls away. If the drop from the top is steep and the tail extends much further than expected, you may be looking at power law behaviour.
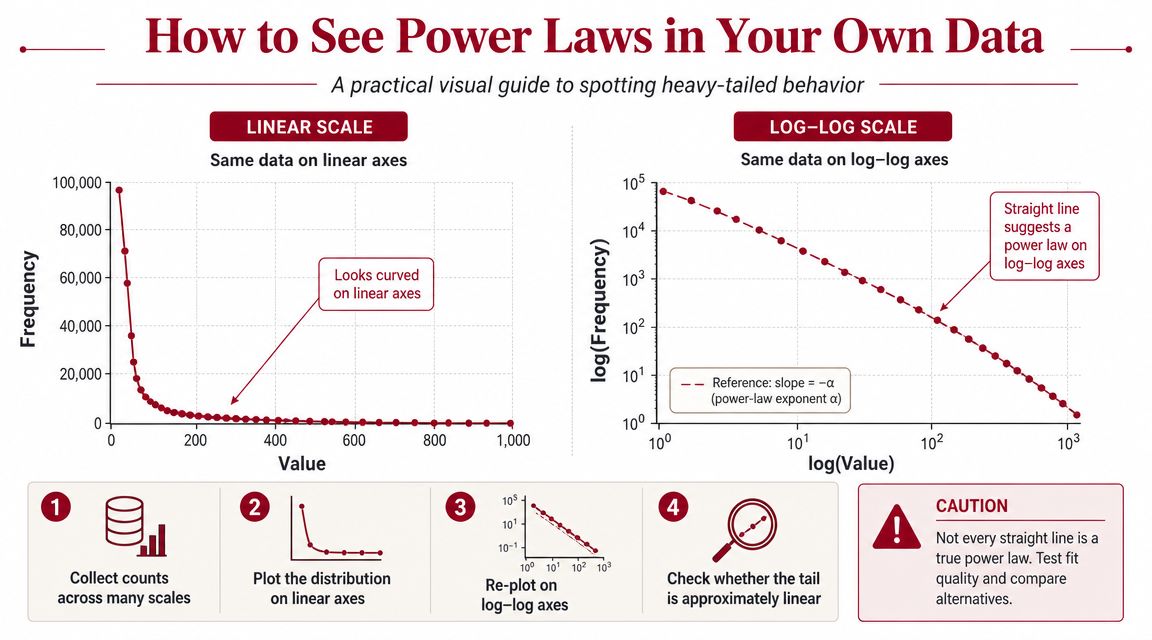
Start with ranked operational data
One pattern we continue seeing is that brands collect plenty of data but organise it in ways that conceal structure. Monthly totals, blended channel dashboards and average order reports often flatten the very signal leadership needs.
Start with ranked views such as:
- SKU velocity by market: strongest to weakest by units, revenue or contribution
- Search and discovery pathways: which terms, pages or placements repeatedly lead to purchase
- Channel contribution: marketplace, wholesale, DTC and distributor performance ranked by commercial impact
- Account concentration: which partners influence visibility, operational reliability or reorder rhythm
This is often where hidden concentration becomes visible. It's also where teams realise that discoverability isn't broad at all. It clusters. If you're evaluating search-led marketplace performance, a sharper understanding of Amazon product discoverability often reveals why some catalogues look active but remain commercially shallow.
Use a log-log view as a visual check
A log-log plot sounds technical, but the idea is straightforward. You chart rank on one axis and performance on the other, using logarithmic scales for both. If the relationship starts to resemble a straighter downward line than a curved collapse, that can indicate power law behaviour.
You don't need to overcomplicate this. The strategic value isn't in proving a theorem. It's in seeing that your business may not operate in an “average-case” world.
When the chart shows a steep head and a persistent tail, treat concentration as a structural fact, not a temporary anomaly.
What the insight changes
Once that pattern becomes visible, several management habits need to change.
- Forecasting shifts from averages to concentration. You stop assuming the median product tells you enough.
- Range strategy becomes more deliberate. You separate scale products from support products.
- Expansion sequencing improves. You lead with the products and channels most likely to create local market gravity.
- Risk review sharpens. You can see whether the business is diversified in appearance but concentrated in outcome.
This matters most when leadership is deciding where to commit finite attention. A power law distribution doesn't just describe data. It exposes where the business is being carried.
The Power Law in Marketplace Ecosystems
Marketplace ecosystems make power law behaviour easier to miss because they look broad from the outside. There are many sellers, many products, many search terms and many routes to market. But once you examine how attention and purchase intent move, concentration appears quickly.
One pattern we continue seeing across multiple marketplace ecosystems is that growth rarely comes from equal participation across the whole environment. It comes from securing position in a small number of high-impact nodes.
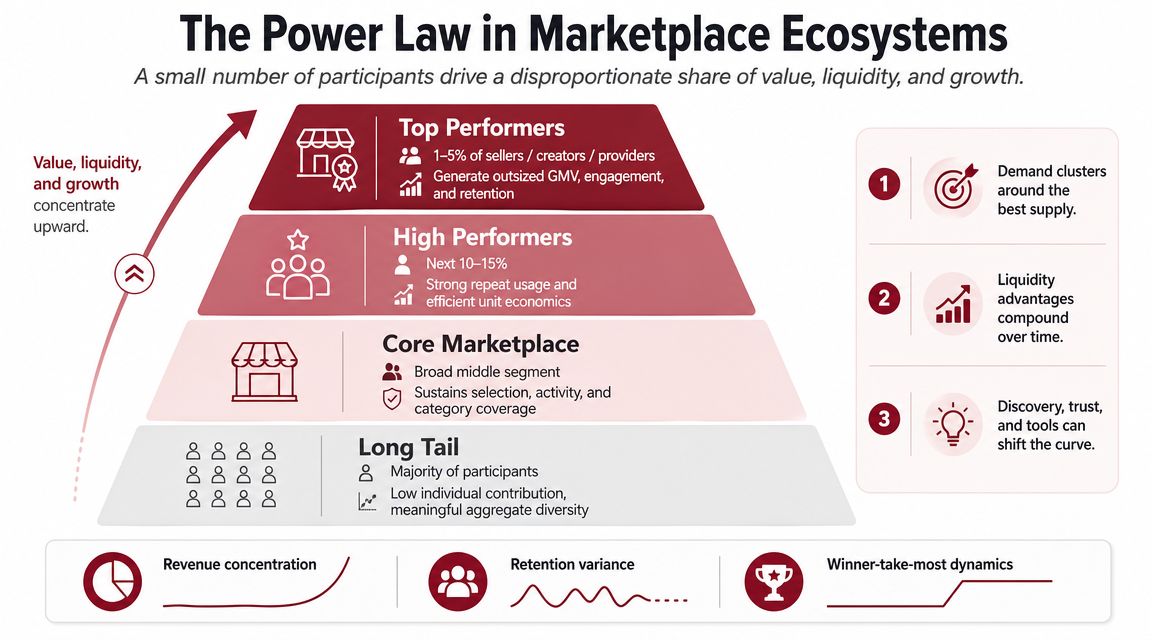
Channel concentration is not a side issue
Australia's digital economy offers a clear example. The Australian Competition and Consumer Commission reported that Google Search had about 95% share of general search queries in Australia in 2022, while Meta's Facebook and Instagram together accounted for the majority of social media time, highlighting how attention concentrates in a small number of dominant platforms, as summarised in this power law distribution reference.
For product brands, that's more than a media observation. It means customer discovery is structurally uneven. A brand can't assume that broad digital presence equals broad commercial access when a few platforms capture most intent.
That's why marketplace planning has to be ecosystem-aware. A coherent marketplace ecosystem strategy starts by identifying where intent, trust and fulfilment confidence already concentrate.
Three places the pattern shows up
In operator terms, the power law usually becomes visible in three places.
SKU velocity
A small number of products tends to create the strongest pull. These products gather reviews, rank signals and reorder confidence faster than the rest of the range. Once that starts, the gap widens because marketplaces favour proven momentum.
Channel hierarchy
Not every route to market carries equal discovery value. Some channels become central because customers begin there, compare there or validate there. Others still matter, but their role is supportive rather than primary.
Geographic opportunity
International expansion also behaves unevenly. Certain markets are easier to localise into, easier to fulfil into or better aligned with the category's existing buying logic. Those markets often create disproportionate strategic returns because success in one region can strengthen the next move.
A broad expansion map can look disciplined in a board deck while still scattering the business across low-leverage terrain.
Why founders misread this
Founders often confuse surface variety with underlying diversity. A catalogue can appear diversified because it spans many SKUs. A channel mix can appear balanced because revenue appears across several sources. But if discoverability, trust and replenishment all cluster around a small core, the business is still operating inside a skewed structure.
What becomes visible during international expansion is that this skew intensifies. New markets don't reset the distribution. They create a new version of it. A few products travel well. A few channels matter early. A few operational decisions determine whether the brand establishes presence or remains just another imported listing.
Strategic Consequences for Brand Expansion
Once you accept that a business may operate within a power law distribution, expansion strategy changes. The objective stops being even coverage. It becomes controlled concentration.
That doesn't mean becoming narrow. It means recognising that different parts of the portfolio deserve different strategic roles, and that not every commercial signal should trigger equal investment.
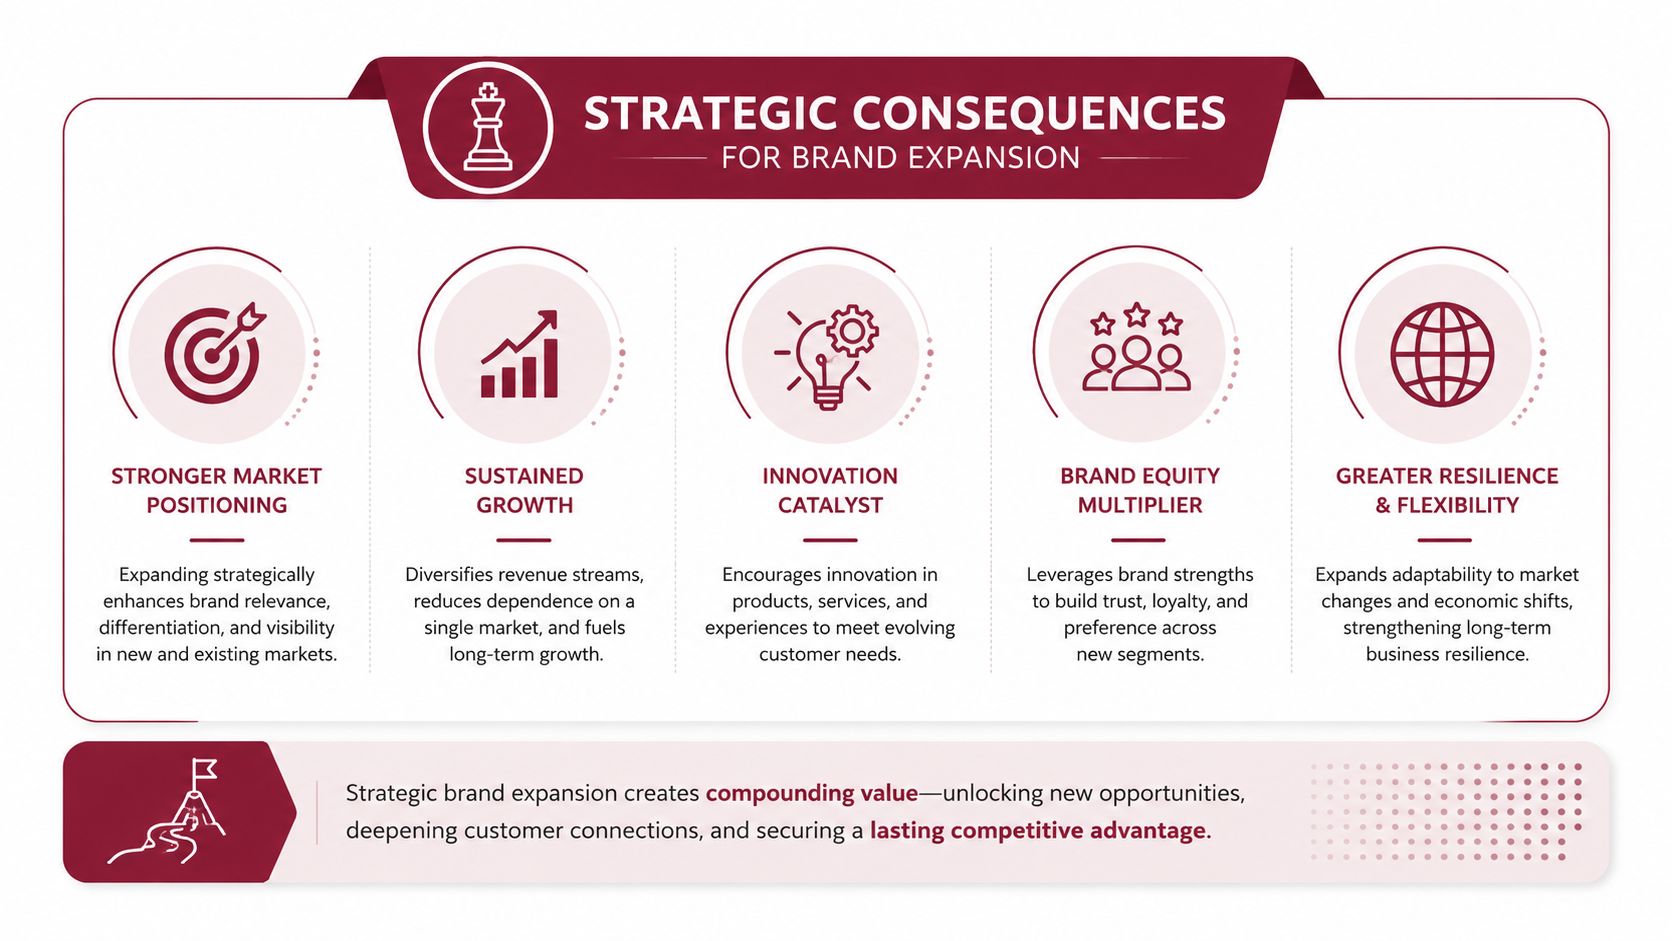
Concentrate where the market already compounds
The strongest brands usually do three things better than their peers.
- They protect the head of the distribution. Their best products receive sharper availability control, stronger content consistency and clearer localisation support.
- They use the tail intentionally. Tail SKUs become tools for market learning, retailer fit or niche capture, not symbolic proof of catalogue breadth.
- They sequence channel entry. They don't treat every marketplace, distributor or geography as equally urgent.
This is especially important in international expansion. A broad launch can create the illusion of momentum while burying the underlying issue, which is whether the business has achieved concentrated traction anywhere meaningful. Stronger operators would rather build one commercially coherent beachhead than scatter inventory and attention across too many partial openings. That's one reason serious brands approach Amazon expansion as a staged market entry problem, not a listing exercise.
The distribution is not the explanation
There's another point many teams miss. A power law shape tells you what the outcome looks like, but not why it formed.
As noted in this discussion of power law mechanisms, the same tail shape can arise from different mechanisms such as preferential attachment or self-organised criticality, which means the distribution is often an outcome rather than an explanation and should be paired with operational data before scaling decisions are made.
That distinction matters commercially. A brand may see that one marketplace dominates sales, but the cause could be search structure, fulfilment reliability, local pricing coherence, review density, retailer trust or incumbent weakness. Those are different strategic problems. They require different responses.
Operator view: Don't mistake a pattern for a cause. The shape tells you where to investigate, not what to believe.
What this means in practice
A commercially mature response usually looks like this:
| Strategic question | Weak response | Strong response |
|---|---|---|
| Top SKU momentum | Spread support evenly across the range | Reinforce the few products already creating market trust |
| Tail catalogue decisions | Keep every SKU live everywhere | Match tail products to specific channel or market roles |
| New market entry | Launch broadly to test demand | Lead with the products most likely to establish local proof |
| Channel underperformance | Assume the market is weak | Diagnose whether discoverability, pricing or fulfilment is blocking concentration |
Here, experienced expansion work becomes less theoretical and more operational. The shape of the distribution should inform resource allocation. It shouldn't replace diagnosis. Teams that ignore that distinction often overcommit to the wrong market, overstock the wrong line or misread early traction as scalable demand.
Building a Commercially Resilient Global Footprint
Once you stop treating marketplace performance as evenly distributed, a more useful expansion logic appears. Markets are structured. Attention is structured. Product demand is structured. The task isn't to overcome that reality. It's to build around it intelligently.
That changes how a brand thinks about international scale. Expansion stops being a race to list more products in more places. It becomes a sequence of ecosystem decisions about where trust forms fastest, where fulfilment supports repeat purchase, and where a small number of products can establish enough credibility to carry the broader range later.
What stronger brands recognise early
Across multiple marketplace ecosystems, the brands that travel well usually recognise a few things before they commit too broadly:
- Localisation is selective, not universal. Not every product deserves immediate translation into every market context.
- Fulfilment affects market confidence. Availability, delivery clarity and returns structure influence whether demand compounds or stalls.
- Channel roles differ by region. The same marketplace can serve as a launchpad in one country and a validation layer in another.
- Catalogue breadth needs hierarchy. A coherent entry range beats an oversized export of the home-market assortment.
Those judgements are difficult to make if leadership still believes growth should spread naturally across the whole system. In practice, it rarely does. Commercial resilience comes from knowing which few decisions matter disproportionately.
The real value of seeing the pattern
The phrase power law distribution is useful because it gives founders a disciplined way to interpret market behaviour that can otherwise feel erratic. But the deeper lesson is about structure.
A recent marketplace review revealed that many expansion issues aren't caused by weak products. They come from weak ecosystem alignment. The catalogue is too broad for the market entry stage. The channel mix fragments attention. The fulfilment model undermines confidence. The localisation work lands unevenly across the range.
That's why commercially mature expansion looks calm from the outside. The brand isn't trying to win everywhere at once. It is reinforcing the few places where traction can become durable.
A resilient global footprint is built the same way strong marketplace positions are built. Through concentration where the market already has advantage, discipline around the long tail, and a clear understanding that expansion is an ecosystem transition rather than a distribution exercise.
TPR Brands helps established product companies make those decisions with more clarity. If your team is assessing marketplace structure, channel concentration or international expansion across Australia, the US, Canada or the UK, TPR Brands brings an operator-led view of how strong products become commercially cohesive brands across markets.